

An original analysis of results, attacking statistics and what betting odds tell us
Home teams win 44.40% of football matches, compared with 29.63% for visiting sides. That is the headline finding from a study of 145,430 completed, non-neutral matches using historical data from Footiqo. But the size of the advantage varies between leagues and seasons, and historical betting prices offer an important second perspective.
Home advantage, by the numbers
Across the 145,430 matches in the 90-minute results sample, home teams recorded 64,567 wins, visitors won 43,085 times and 37,778 games finished level. The home-win share was 14.77 percentage points higher than the away-win share. Home sides also scored 1.491 goals per match on average, against 1.171 for away sides.
|
Full-time result |
Matches |
Share |
|
Home win |
64,567 |
44.40% |
|
Draw |
37,778 |
25.98% |
|
Away win |
43,085 |
29.63% |
Based on completed, non-neutral matches with 90-minute results.
These raw results clearly show a home-team advantage in the observed sample. They do not isolate the independent impact of the venue, however: team quality, competition structure and the distribution of fixtures also affect win rates.
Which of Europe’s Big Five leagues has the strongest home advantage?
LaLiga tops the five major European domestic leagues for home wins, at 45.73% across 4,249 matches. Bundesliga and the Premier League follow closely, while Serie A has the lowest rate in this group, at 42.35%. The difference between LaLiga and Serie A is 3.38 percentage points.
|
League |
Matches |
Home wins |
|
LaLiga |
4,249 |
45.73% |
|
Bundesliga |
3,401 |
44.31% |
|
Premier League |
4,230 |
44.23% |
|
Ligue 1 |
3,899 |
43.73% |
|
Serie A |
4,229 |
42.35% |
Big Five data use the same completed-match selection rules as the headline sample.
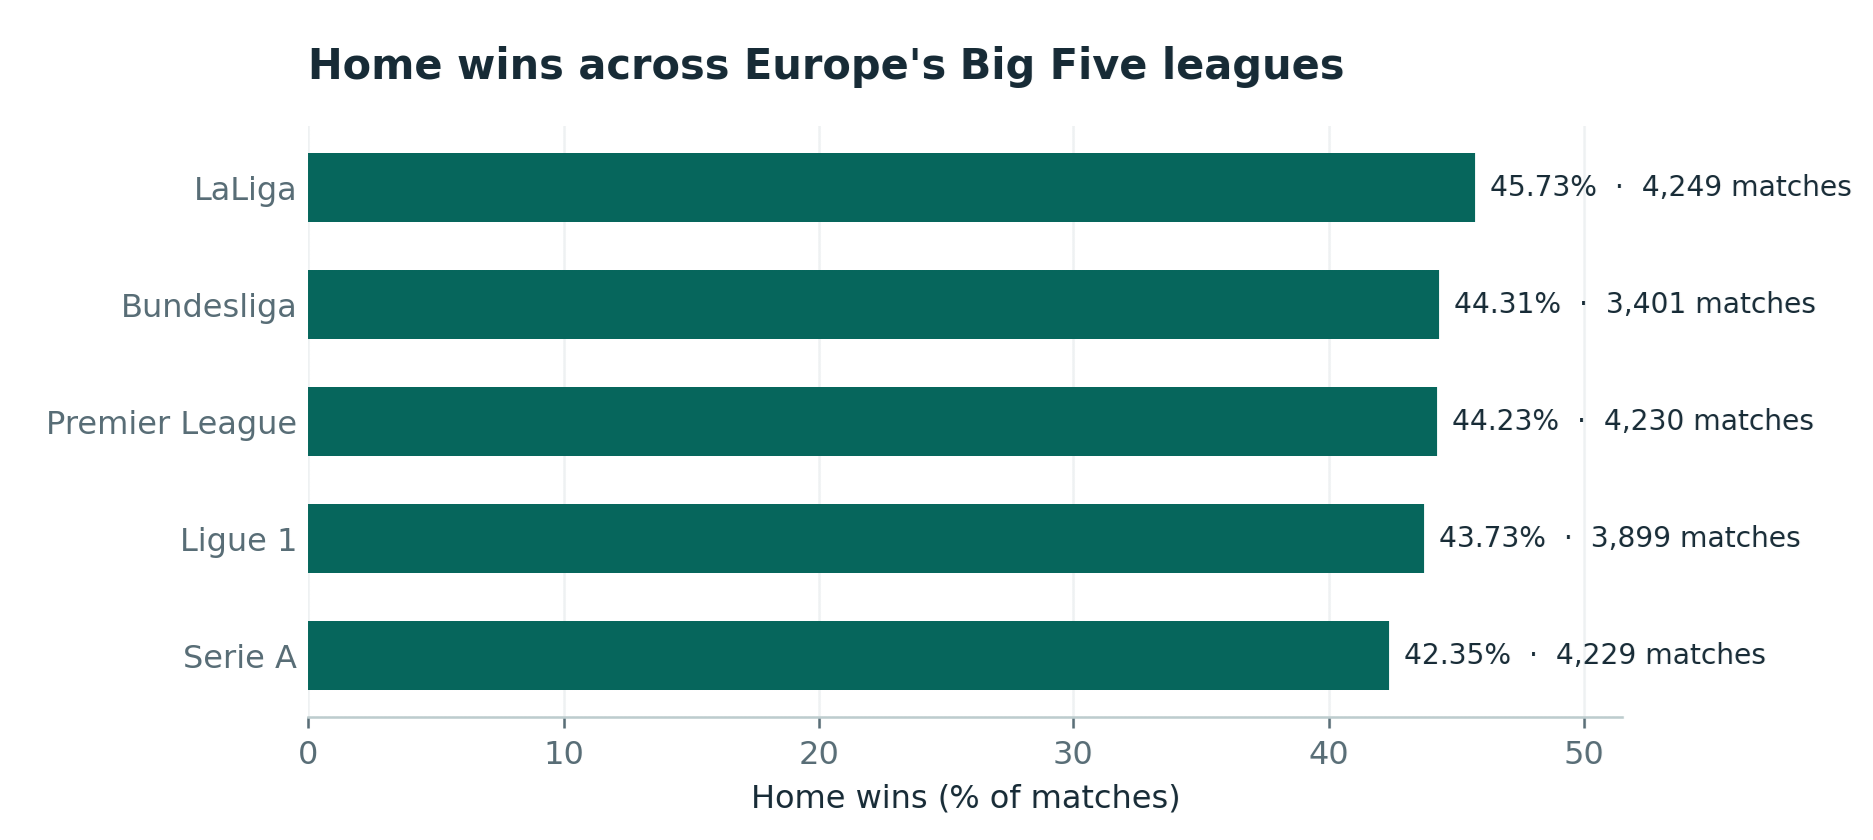
The highest home-win percentage among these leagues is in LaLiga; all rates refer to historical sample matches.
Has home advantage changed over time?
The annual trend is not perfectly stable. Home teams won 45.58% of matches in 2019, but the figure fell to 42.27% in 2020 before reaching 45.10% in 2023. In the partial 2026 dataset, the figure stands at 44.50%.
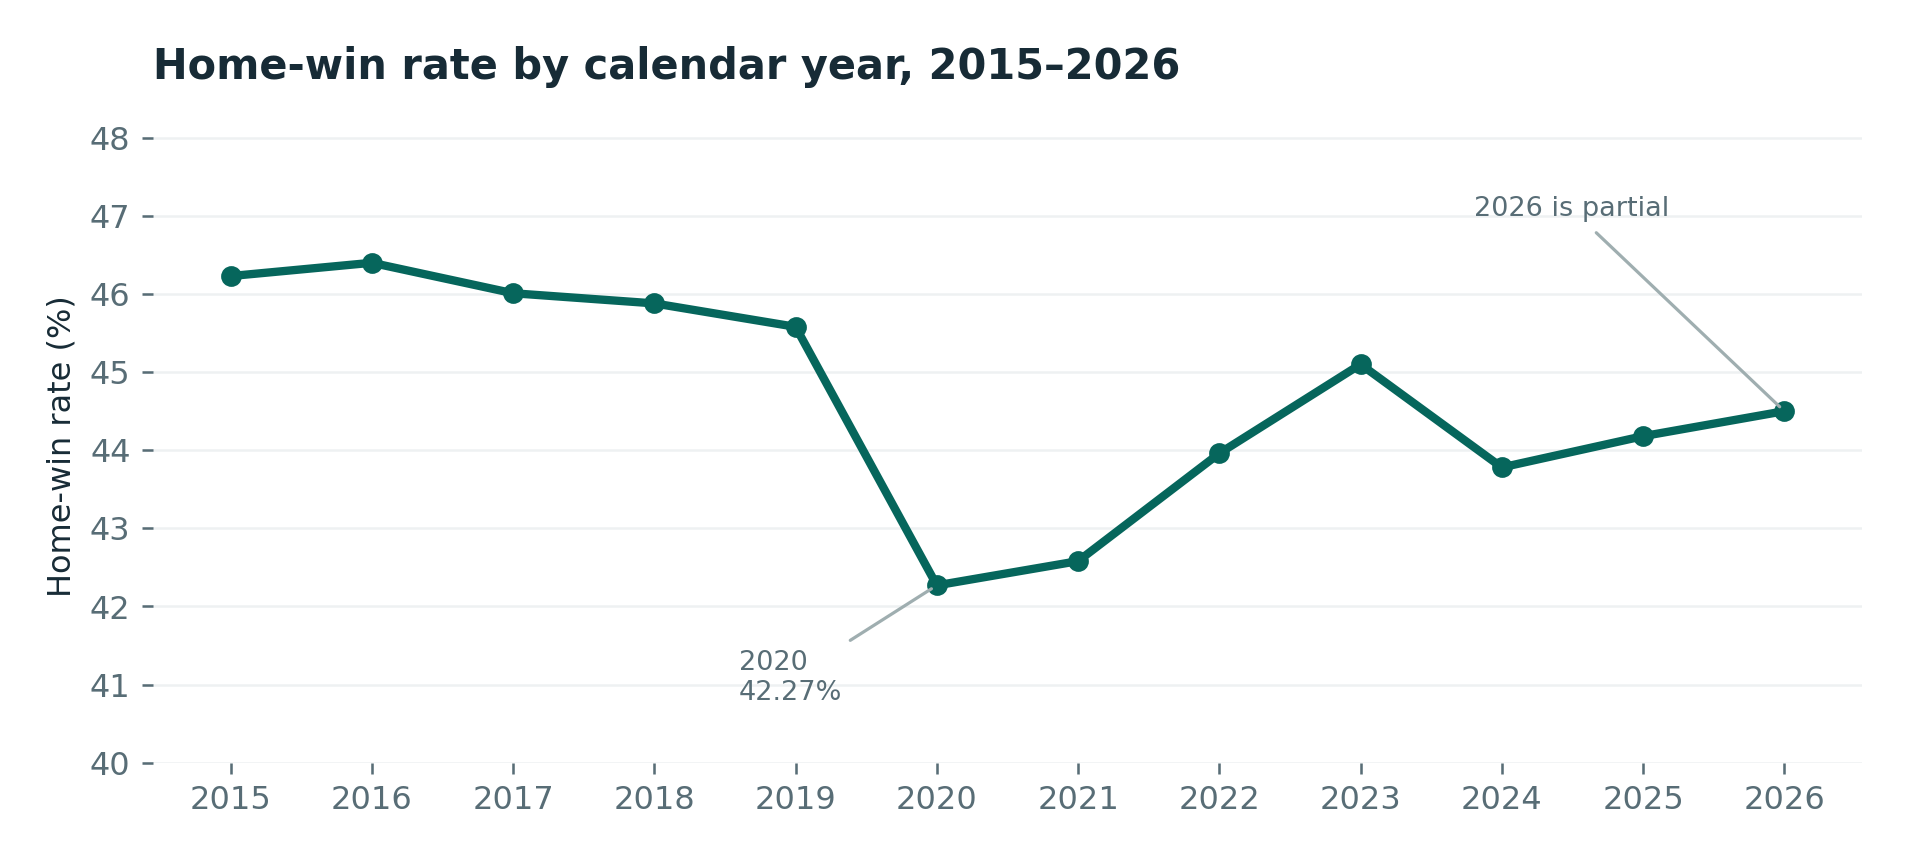
Calendar-year grouping, with partial coverage in 2015 and 2026. Competition coverage may vary by year.
The 2020 decline is noticeable, but these figures alone cannot establish why it happened. Changes in the competitions represented, team strength and match context can all influence the aggregate series.
Beyond the scoreline: more shots, xG and corners at home
The attacking data tell a similar story. Home teams averaged 12.986 shots per game, compared with 10.707 away. The corresponding figures were 4.723 versus 3.862 shots on target, 1.106 versus 0.848 expected goals (xG), and 5.333 versus 4.392 corners.
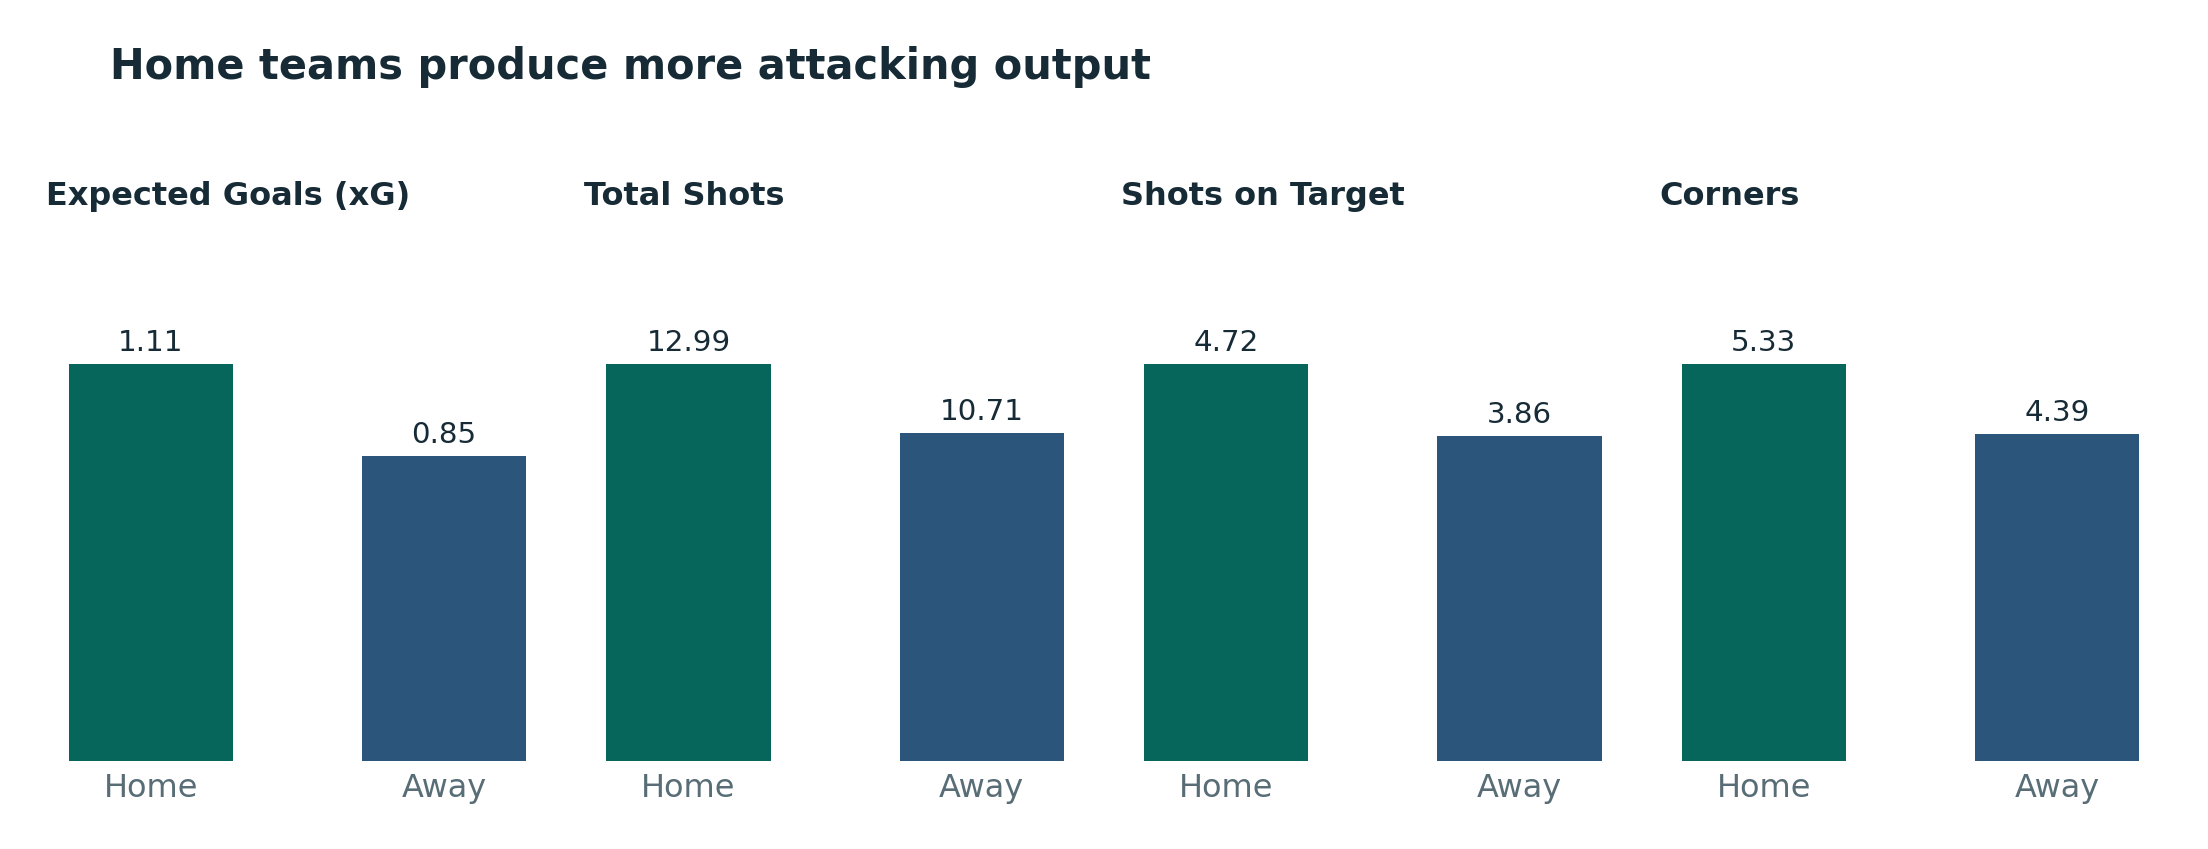
Paired home/away observations from 145,259 matches for each attacking metric shown.
Home teams also received slightly fewer yellow cards, at 1.962 per match compared with 2.214 for away sides, based on 145,264 fixtures with paired card statistics. These are descriptive differences; they do not establish that the venue alone caused them.
Do betting odds already account for home advantage?
A strong home record is not automatically a betting opportunity. We compared match outcomes with no-margin home-win probabilities calculated from all three closing 1X2 odds. Complete closing odds were available for 145,290 matches in the same underlying selection. Every match was grouped according to its estimated chance of a home win.
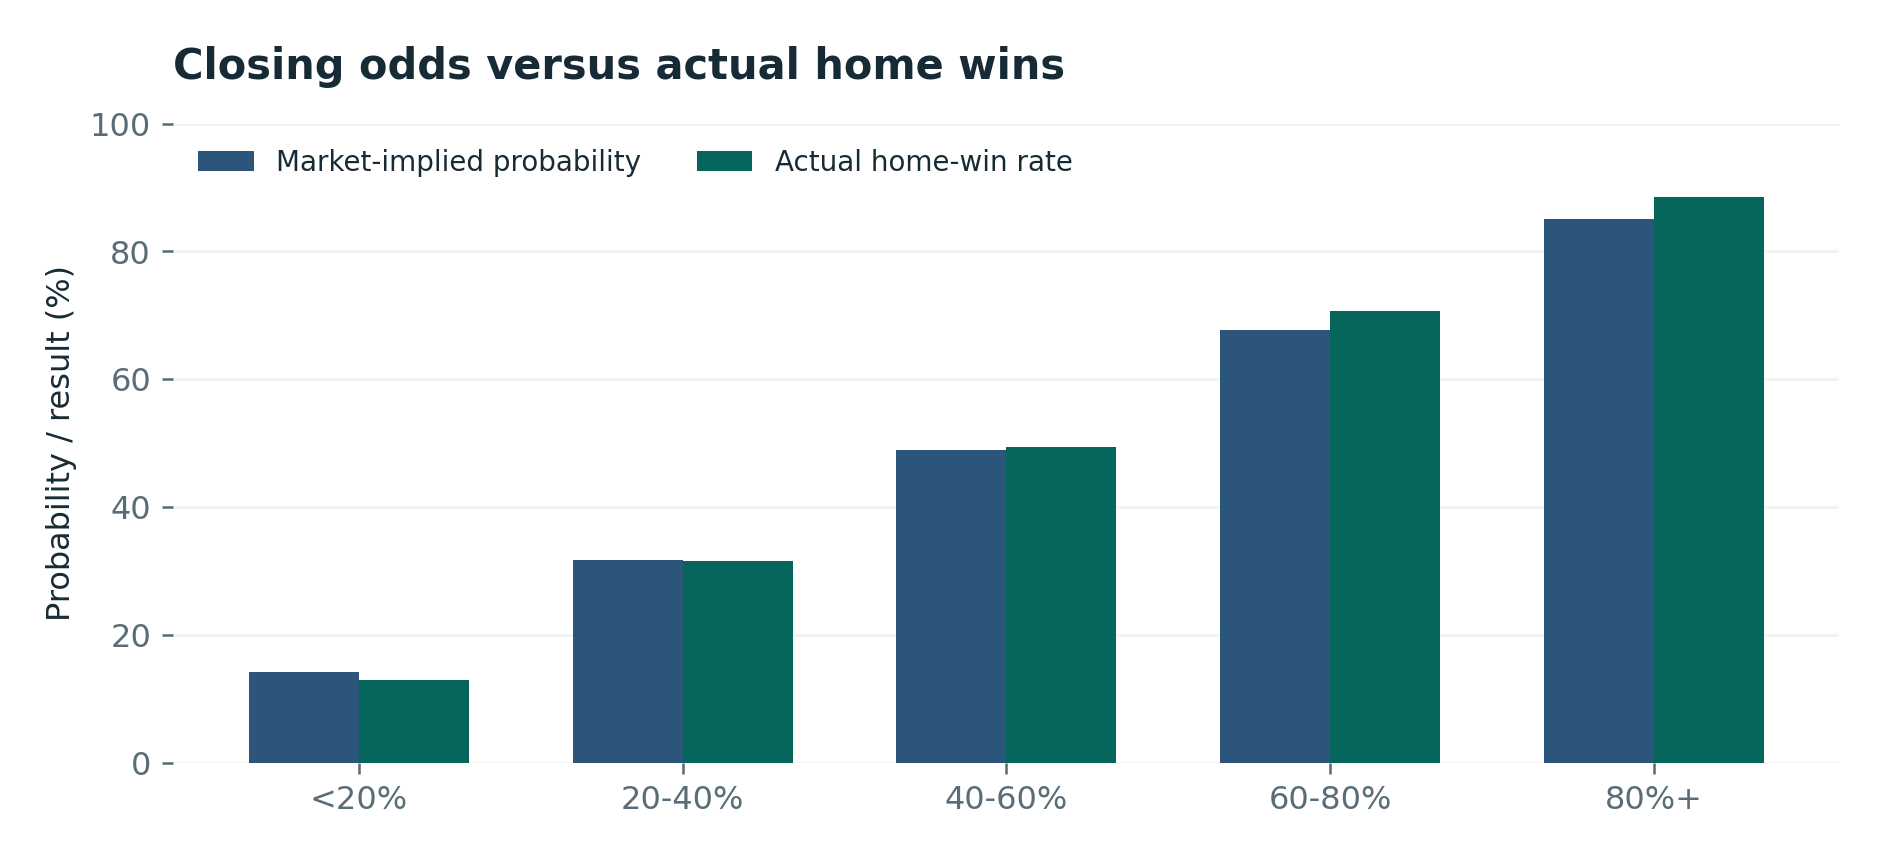
Closing 1×2 probabilities normalised to remove the bookmaker overaround, compared with observed home wins.
Where estimates and results differ
|
Market home-win |
Matches |
Market |
Actual home |
|
Below 20% |
10,191 |
14.11% |
12.97% |
|
20-40% |
50,818 |
31.75% |
31.58% |
|
40-60% |
60,953 |
48.93% |
49.36% |
|
60-80% |
20,237 |
67.71% |
70.74% |
|
80%+ |
3,091 |
85.02% |
88.52% |
Closing-odds sample: 145,290 matches. Each band uses its average estimated probability.
In the 20–40% probability band, home teams won 31.58% of matches against a 31.75% average market estimate. In the 40–60% band, the figures were 49.36% and 48.93%. Among stronger home favourites, the observed win share was higher: 70.74% versus 67.71% in the 60–80% band, and 88.52% versus 85.02% above 80%.
These differences are worth further analysis, but they are not evidence of a profitable betting strategy. The bookmaker market already factors in venue, team strength and other circumstances; probabilities and results must be compared on a like-for-like basis.
Three findings that stand out
What this means for football analysis
Home advantage is a persistent feature of these historical results, reflected both in final scores and in several attacking measures. Yet its magnitude is not constant: league, season and pre-match expectations all matter. For analysts, the more useful question is not simply whether home teams tend to win, but how much home conditions change expectations once the teams and the market context are considered.
Methodology and data source
Data source: Footiqo historical football database. The study includes 145,430 matches from 2015 to October 2026 where the recorded status is FINISHED or AFTER 90 MINUTES, the venue is not marked neutral and both full-time goal values are present. The main results and league comparisons use all matches meeting these criteria; individual statistics and closing-odds comparisons use the subsets with complete relevant data. All listed rates and averages are historical observations, not predictions.
For the betting-market comparison, implied home-win probabilities were calculated from the reciprocal of home, draw and away closing odds, divided by their sum to remove the overround. Calendar-year figures reflect the available competitions in each year; the first and final years are incomplete. As an observational study, the analysis does not establish a causal stadium effect or betting profitability.


Leave a Reply